The horrific wildfires currently burning in the Southern California region have already been devastating for some and have many others understandably concerned. In addition to the damage from the fires themselves, smoke inhalation could present health risks to people in the area. Safecast currently has 30 Solarcast units deployed in the LA area, which are equipped to measure particulate levels in air.
In response to requests, we have added indications on our web-based map showing the extent of the fires as of Dec 9th, 2017. We have included five fire zone boundaries so far. They are: Thomas fire, Rye fire, Skirball fire, Creek fire, and Lilac fire. We hope they are informative. We can add more if it becomes necessary.

If the fire zone indications are not automatically displayed when you view the Safecast tilemap :
— Expand the control menu on the left-hand side of the window.
— Scroll down until you see “Areas.” Toggle the selector switches for the fire zones to the “on” (blue) position.
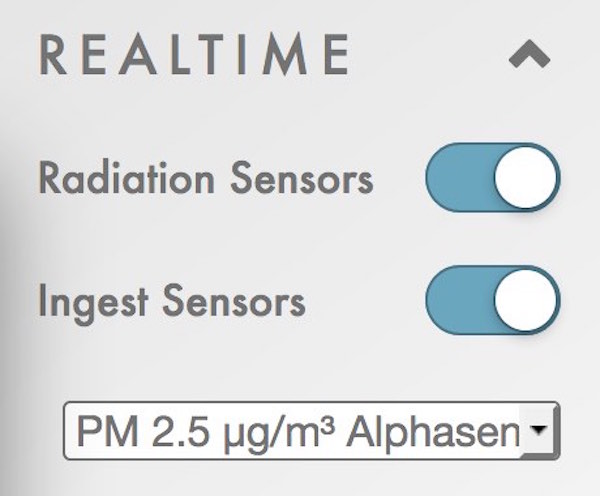
— If not already displayed, the Safecast Solarcast air quality measurements can be displayed by toggling the “Ingest Sensors” selector to the “on” position as well. An additional selector below that allows PM size and several other Solarcast measurement parameters to be chosen also.
Please note:
— The Safecast map is not a fire map! The fire boundary guidelines we provide are for information and context only. For safety information please consult reliable fire maps such as this California State fire map, this Google Crisis map and this Direct Relief map.
—So far, almost all of the fires have been west of our sensors, and the wind has been blowing smoke westward over the ocean as well. This means our Solarcasts have not been in a position to detect much yet. Santa Ana winds shift quickly and unexpectedly, however, so if the wind shifts direction and blows towards us we expect to be able to detect the fire-related soot and other particulates.
— A look at individual sensors on our map already shows spikes which may be correlated with short term wind shifts. We haven’t done any deep data analysis of this yet, but it’s another point of reference that might be helpful to people living in areas near the sensors, and potentially more informative than news announcements saying merely “the air is bad today.”
Safecast continues to be concerned for everyone who is affected by this disaster, and will provide more information and context as it becomes available.