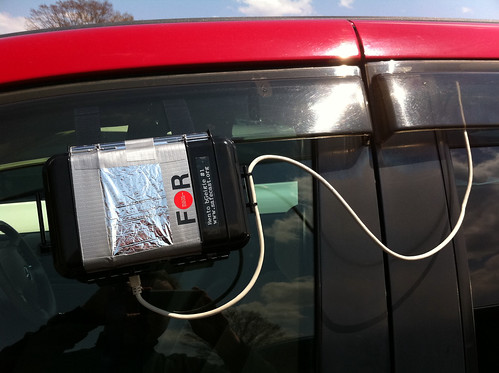
Last week a team from Keio University took one of our geiger counters for a drive. That was a test run for our slightly more elaborate set up, the first test of which happened this weekend. Rather than taping the counter to the window and taking photos (a method which worked fine btw) we’ve developed a bit of a self contained kit we’re calling the bGeigie since it’s something like a little bento box. We dropped off sensor equipment to volunteers in effected areas and took some measurements at schools around Koriyama that we’re a bit concerned about (including one reading of over 50µSv/hr near a kindergarten playground). Admittedly we are not experts on radiation measurement, but here is what we are doing and what we found:

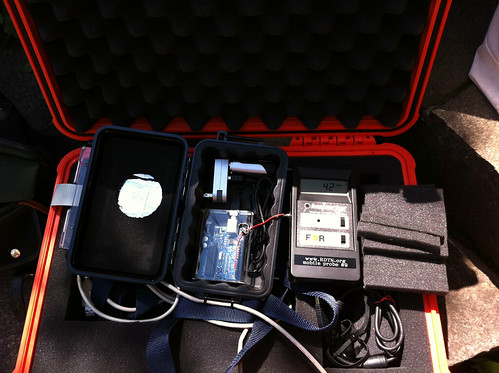

Our new set up includes two geiger counters (one mounted outside the car, one handheld inside which can also be used if stopped and walking around), a laptop, a GPS module, mobile wifi hotspot and some weather proof casings. Once installed on a car this lets us track a great deal of info and upload it immediately. This is what we’re collecting data wise:
- • year-month-day
- • hour:minute:second
- • CPM (counts-per-minute)*
- • Latitude: ddmm.mmmm, dd is integer in degree, mm.mmmm is decimal in
minute. We can divide mm.mmmm by 60 to get degrees. - • N/S (north/south indicator)
- • Longitude: dddmm.mmmm, ddd is integer in degree, mm.mmmm is decimal
in minute. We can divide mm.mmmm by 60 to get degrees. - • E/W (east/west indicator)
- • GPS Quality indicator
- • Number of satellites available
- • Precision in metres
- • Altitude in metres
- • GPS Device name
- • Measurement type
*The use of CPM is noteworthy since most of the reports are currently using µSv/hr. There is currently a great deal of discussion about which measurement is better or more accurate as µSv/hr doesn’t specify isotopes and can vary based on what is being measured. In our case however the International Medcom Inspector Alert geiger counters that we are using displays both, but output via the connector is CPM. We’re taking note of both and using µSv/hr in discussion but will continue to look into this and evaluate which is a better unit of measurement for these purposes. In this case dividing CPM by 350 gives us µSv/hr.
Our plan has been to install this system into a car and then drive north into Fukushima to elementary, junior high and high schools outside of the evacuation zone and try to get some readings there and along the way. Assuming that worked we’d replicate this set up in several cars so we can cover ground more quickly. For this run we several more hand held counters just to double check the readings and set ups.


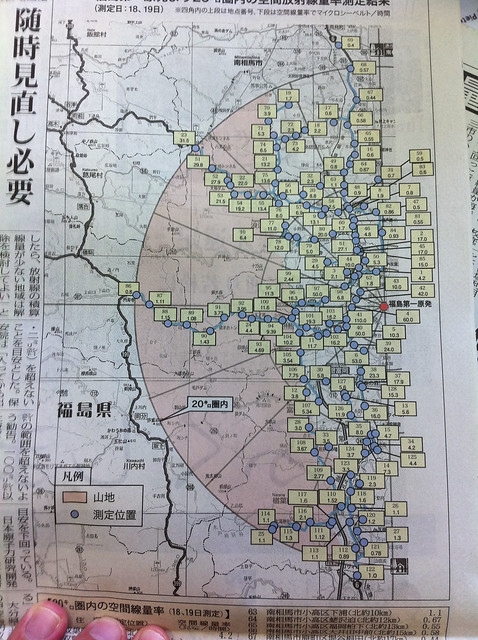
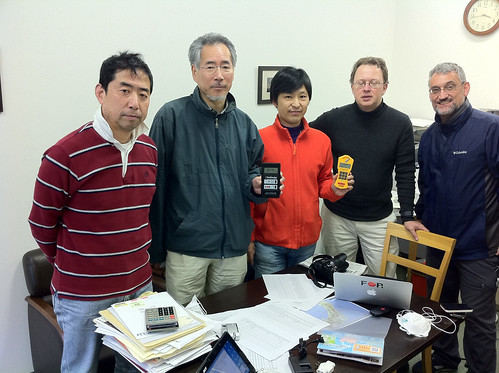
On Saturday, April 23rd we gave this the first field test. Japan team members Mauricio, Pieter, Robin and Steve met up at Tokyo Hackerspace first thing in the morning, hooked things up, tested them and hit the road. The Fukushima newspaper printed a radiation map showing readings around the evacuation zone which was you can see had quite a bit of variance so we hoped to get more data to cross reference with this.
Additionally part of our mission is to distribute equipment to people who can continue to take readings on their own after we’ve left and have them continue to upload data to our site so we will have historical data as well. I’m happy to happy to announce that we did just that with this trip to Koriyama and were able to leave two sensor devices and an iPhone (for uploading images and data to our servers) with a team of volunteers there.
As for the actual data we recorded, that was very interesting. We’re in the process of checking the logs (removing duplicate entries and things) and will have it uploaded to our map and pachube shortly so every point we recorded will be visible and available for evaluation by outside parties. Here is photo documentation of some of the readings we took with the handheld devices. All in all we drove for 6.5 hours and measured close to 5000 locations. We measured at the gate of 5 schools in Koriyama.
We took one reading that was considerably higher than all the others:

This was the highest we reading we took, but we consistently measured 20-30µSv/hr on pavements, etc. and 5-10µSv/hr for soil (typically 5-6 for soil) For air measurement, we have very consitent data as it is measured across the entire ride. In Koriyama it was in the range of 1.2 to 2µSv/hr. We had 3 Medcom devices giving consitently the same value and a Gamma Scout that gave same readings for air. This multiple redundancy was to ensure we didn’t have malfunctioning equipment or a calibration error.
To put those numbers into some perspective, on Sunday April 24th we measured 0.089µSv/hr in the air and 0.227µSv/hr on the ground at in the Silver Lake neighborhood of Los Angeles. Furthermore in Japan, radiation worker dose limits pre-Fukushima were 100 mSv/yr and the dose limit for normal person is 1 mSv/yr. 50µSv/hr is equivalent to annual dosage of 438 mSv which is more than 4x higher than the limit for nuclear radiation workers.
There are caveats to those numbers of course and as I mentioned the Sievert is the subject of some disagreement in and of itself. Additionally those limits may be focused primarily on high energy gamma, where as our sensors measure alpha and beta which are included in our µSv/hr measurements. Some sensors only measure high energy gamma. Alpha and beta particles are slower and penetrate less so may be considered less dangerous for exposure, but when ingested or inhaled can concentrate in certain organs and cause even more damage than a blast of high energy gamma. In other words, 50µSv/hr on the wall might end up being concentrated into a tiny 1cc square in your thyroid and might end up causing a much more concentrated dose into a particular set of cells than say a 50µSv/hr blast at your body with high energy gamma which would hit all of your cells mostly evenly. Think of the difference between the concentration of radiation used for killing cancer cells vs the wide spread used in an xray. Even that is confusing but we’ve found this infographic to be helpful in understanding different kinds of radiation and doses.

Again we want to make it clear that we are not radiation experts nor health physicists – we aren’t making any claim about how safe, or not, any of these measurements might be – rather we are trying to find and provide data that could be important for residents of these areas so that they can make informed decisions on their own. It’s one thing to be told everything is fine, it’s another thing to have access to the actual measurements and make that decision on your own. That said we are actively looking for experts to help us interpret this data and improve our protocols. If you or someone you know can help us there please get in touch. We expect to continually review and revise our methods as we continue to learn more about this ourselves. This is just the first of many runs we’ll be making in Japan, and with each one we plan to distribute more sensors to help build a clearer picture of what is happening on on ongoing basis.
These efforts have so far been funded by the kindness and donations of a few people but we’re going to need more financial help to keep this up. If you’d like to chip in a few dollars, please check out our kickstarter fundraiser. Thanks so much.

私達が今回使用した機器構成は、ガイガーカウンター2台(1台は車の外側に取り付け、1台は車の中で手に持ち、手に持つ方は車を止めて歩き回る際にも使用)、ノートPC、GPSモジュール、モバイルWi-Fiホットスポット、耐候性のケースです。機器をいったん車に取り付ければかなりの情報を追跡でき即座にアップロードすることができます。以下が、私達が集めたデータの内容です。
- 年-月-日
- 時:分:秒
- CPM(カウント毎分)*
- 緯度:ddmm.mmmm。ddは整数の度、mm.mmmmは小数点以下含めた分。mm.mmmmを60で割って度を求めることができる。
- NまたはS(北緯か南緯かを示す)
- 経度:dddmm.mmmm。dddは整数の度、mm.mmmmは小数点以下含めた分。mm.mmmmを60で割って度を求めることができる。
- EまたはW(東経か西経かを示す)
- GPSクオリティー表示
- 受信可能な衛星数
- 精度(単位:メートル)
- 標高(単位:メートル)
- GPS機器名
- 測定の種類
* 現在報告されるデータはほとんどがµSv/hr (毎時マイクロシーベルト)を使用していますが、ここではCPMを使用していることが注目すべき点です。µSv/hrは同位体を特定せず、何を計測するかにより数値が変わることから、どちらの測定法がよいか現在かなりの議論がなされています。私達が使用しているInternational Medcom Inspector Alert geiger countersは両方表示しますが、コネクターを通した出力はCPMです。私達は両方の数値を記録し、議論の際にはµSv/hrを使用していますが、この問題を引き続き検討し、このような目的のためにはどちらの計測単位を使用するのがよいか評価したいと思います。今回の場合はCPMを350で割るとµSv/hrが求められます。
私達の計画は、この装置を車内に取り付け、福島に向けて北へ向かい、避難地域外にある小学校、中学校、高校および道中での測定を試みることでした。これがうまくいけば、より敏速に広い範囲を網羅できるよう同じ設備を複数の車に取り付けて測定を実施するつもりです。今回の走行では、測定値と設備を再確認するために持ち歩き用の測定器を多めに持参しました。
4月23日土曜日、私達は最初の実地試験を行いました。日本のチームメンバーであるMauricio、Pieter、Robin、Steveは朝一番にTokyo Hackerspaceに集合し、機材を接続、テストした後出発しました。福島の新聞に避難地域各地の放射線測定値を示す地図が掲載されており、写真から分かるように数値にかなりの差があります。私達はさらに多くのデータを取り、この地図と相互参照してみたいと考えました。
これに加えて今回の走行では、機器を現地にいる方に渡し、私達が去った後も測定を続けデータをアップロードしてもらうことにより時系列データを得られるようにすることも目的としていました。今回の郡山への走行では現地のボランティアチームに2台の測定器と1台のiPhone(画像とデータを私達のサーバーにアップロードしてもらうため)を渡し、この目的を果たすことができました。
私達が実際に取ったデータも非常に興味深いものでした。現在ログをチェックしているところで(重複データを削除するなど)、間もなく当サイトの地図およびPachubeにアップロードする予定です。アップロードされれば、記録を取った各地点のデータが閲覧可能となり外部の方に評価していただくことも可能になります。持ち歩き用の機器で測った測定値のいくつかを、写真に記録したものがここで見られます。全体として、6.5時間走行し、5000弱の地点で計測を行いました。また、郡山の学校5校の校門前で計測を行いました。
全ての測定値の中で顕著に高い数値が計測された場所がありました。
これが私達が測定した中で最も高い数値でしたが、一貫して舗道などでは20~30µSv/hr、土壌上では5~10µSv/hr(土壌上で多かったのは5~6µSv/hr)という値が計測されました。空中での測定では、非常に一貫したデータが計測されました。郡山では、1.2~2µSv/hrでした。3台のMedcom社製の測定器では一貫して同じ数値が計測され、1台のGamma Scoutでも同じ測定値が計測されました。このように複数の機器で計測したのは、機器の不具合や較正誤差がないことを確認するためです。
これらの数値を相関関係の中で理解するために参考数値を挙げると、4月24日日曜日、ロサンゼルス近くのシルバーレイクを計測したところ、空中の測定値が0.089µSv/hr、地面上の測定値が0.227µSv/hrでした。また日本では、福島原発事故以前の放射線業務従事者の被曝限度は、緊急作業時で累積の上限が100 mSv(100ミリシーベルト)で、一般人の被曝限度は1 mSv/yr(年間1ミリシーベルト)です。50µSv/hrというと、年間438 mSv(438ミリシーベルト)の被曝となり、上述の放射線業務従事者の上限の4倍以上になります。
もちろんこれらの数字については補足説明が必要です。上述のように、シーベルト(Sievert)はそれ自体について異論があります。さらに、私達が使用したセンサーではアルファ線とベータ線を測っておりこれらがµSv/hrによる測定値に含まれていますが、上述の被曝限度は主に高エネルギーガンマ線に焦点を合わせたものである可能性があります。センサーによっては高エネルギーガンマ線のみ測るものもあります。アルファ粒子とベータ粒子は速度が遅く透過力も低いため、照射されても危険度は比較的低いと考えられるかもしれませんが、摂取したり吸入したりした場合、内蔵の一部で濃縮され、高エネルギーガンマ線による攻撃より深刻な損傷をまねく可能性があります。言い換えると、壁の50µSv/hrの放射線が最終的に甲状腺の中のたった1cm3に濃縮され、例えば50µSv/hrの高エネルギーガンマ線で体を攻撃された場合(この場合体の全細胞がほぼ均一に攻撃を受ける)に比べ、はるかに高い線量を特定の細胞群が受けることになる可能性があります。がん細胞を破壊するための放射線濃度とX線写真で広範囲に浴びる放射線の違いを考えてみてください。それでもややこしいのですが、様々な種類の放射線および線量に関する理解を助けるこのような解説画像がありましたので、ご参照ください。
繰り返しになりますが、私達は放射線に関する専門家でも、保健物理学者でもありません。私達はこれらの測定値がどれくらい安全か、またはそうでないかを主張しているのではありません。私達は、これらの地域の住民の方々が詳細な情報を得た上で自ら決断できるよう、住民の方々にとって重要である可能性のあるデータを見いだし提供しようとするものです。全て安全ですと言われることと、実際の測定値にアクセスでき自分で決断を下せることは全く別物です。とはいえ、私達はこのデータの解釈と調査手順の改善について積極的に専門家の力添えを求めています。この点で、皆様または皆様のお知り合いでご支援いただける方がおられましたら、ご連絡ください。私達もこの点について学びながら、引き続き方法を見直し修正していく予定です。今回の調査は日本で今後も行っていく調査の第一回に過ぎません。今後調査を実施しながら走行の都度より多くの測定器を配布し、何が起きているかを明らかにしていけたらと考えています。
これらの取り組みはこれまで少数の方々のご厚意と寄付で支えられてきましたが、この取り組みを続けるにはより多くの資金的援助が必要になります。少額でも寄付するよ、という方がおられましたら、このkickstarter募金をチェックしてみてください。お読みいただきありがとうございます。