One of the great utilities of the Safecast project is the ability to collect and analyze environmental data on an unprecedented scale. As Safecast passes the two year mark with collecting radiation data in Japan it is now possible to begin to look back over the changes in radioactivity across different parts of the country and see where this may all be heading.
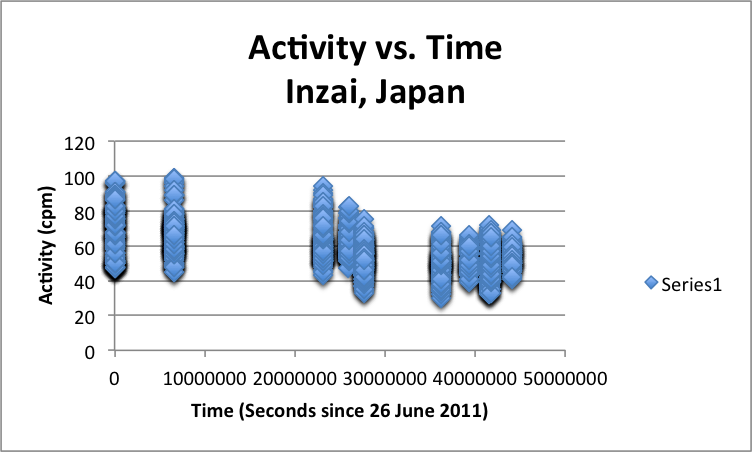
Radioactivity in Inzai, Japan. 18 months worth of data.
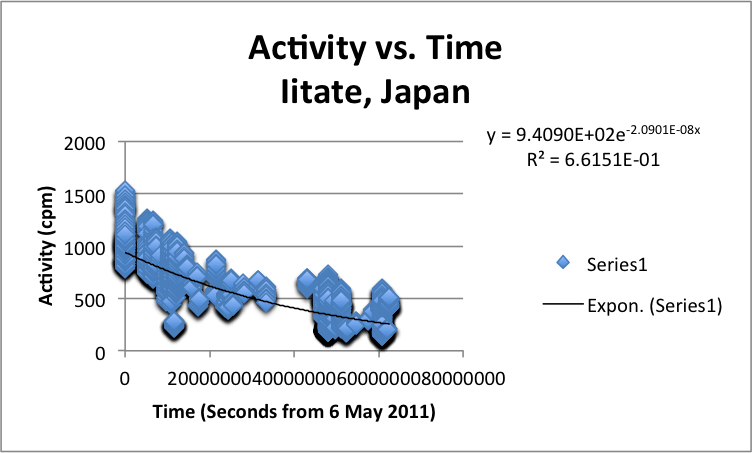
Radioactivity in Iitate, Japan. 24 months worth of data.
A scan of two cities
While events at the Fukushima Daiichi plant have led to the common association of all of Japan with radiation we have collected enough data to show that large swaths of the country remain near background (Approximately 30-40 counts per minute). One example of this is the city of Inzai, which lies between Tokyo and Narita International Airport, and is 193km southwest of the meltdown site. As the first graph shows background levels slightly above what is considered typical, but there is no appreciable change from the middle of 2011 to the end of 2012 in terms of radioactivity.
The next city in our study, Iitate, is about 38km northwest of the Fukushima Daiichi reactor site, and shows both more significant exposure and a noticeable decay curve. What is notable about the decay curve is that a decay half-life can be estimated to reasonable precision with the best-fit exponential decay function. From this method we can estimate the decay half-life for surface radioactivity to be only one year from the two years starting in the middle of 2011. This is notable as the decay half-life for the two dominant radioisotopes, Cs-134 and Cs-137, are two and thirty years respectively. This implies that there are additional mechanisms at work in Iitate which are moving radioactive material away from the surface, such as erosion and the deposition of new topsoil, which are accelerating the decay of measurable radioactivity at the surface.セーフキャストプロジェクトの素晴らしい利用法の一つは、前例のない規模で環境データを収集し分析できることです。セーフキャストでは、2年間にわたって日本における放射線データを収集してきました。今こそ日本の異なる地域横断での放射線変化を振り返ることができます。
Radioactivity in Inzai, Japan. 18 months worth of data.
Radioactivity in Iitate, Japan. 24 months worth of data.
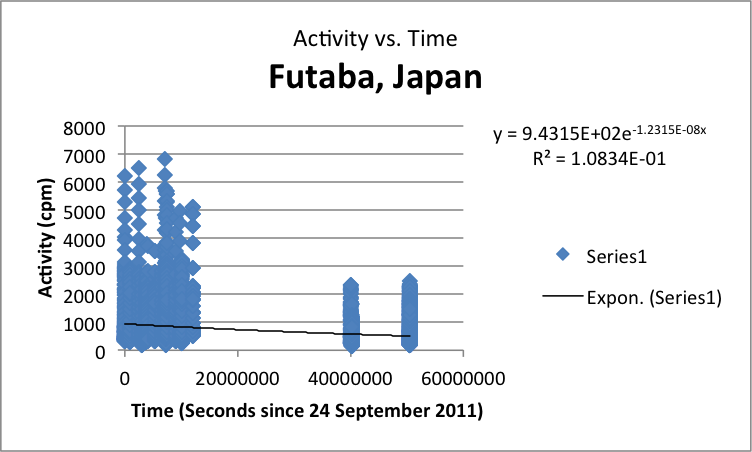
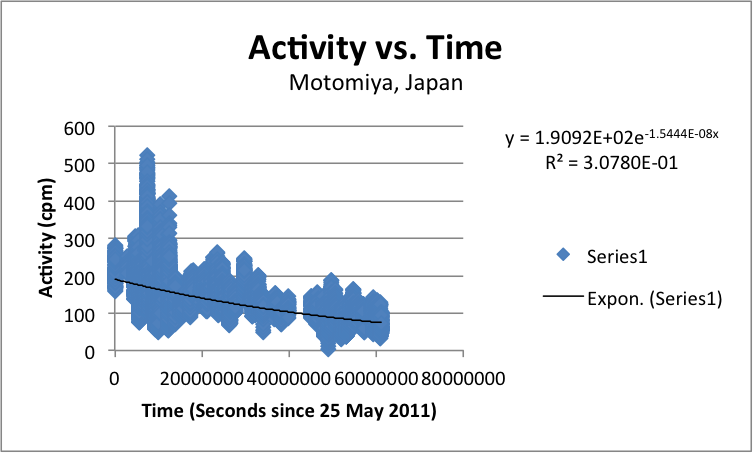
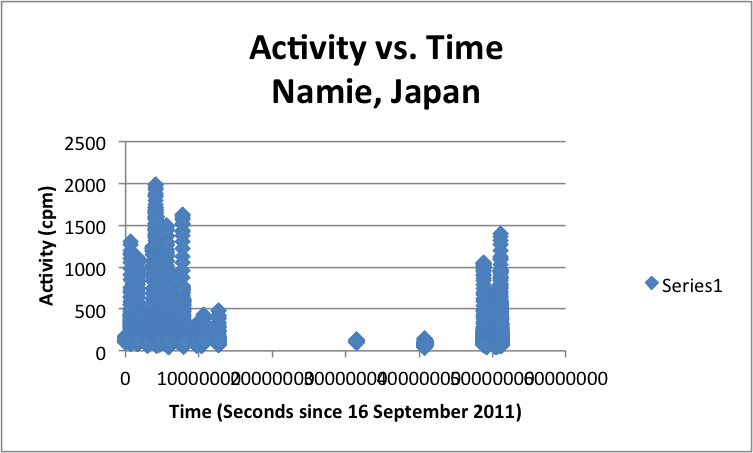
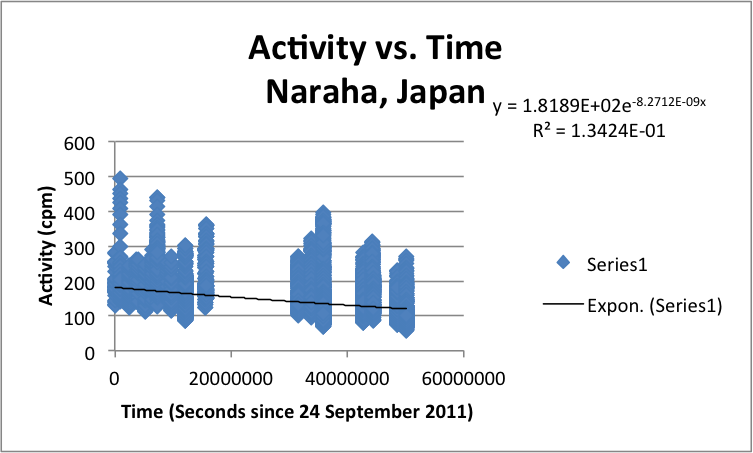
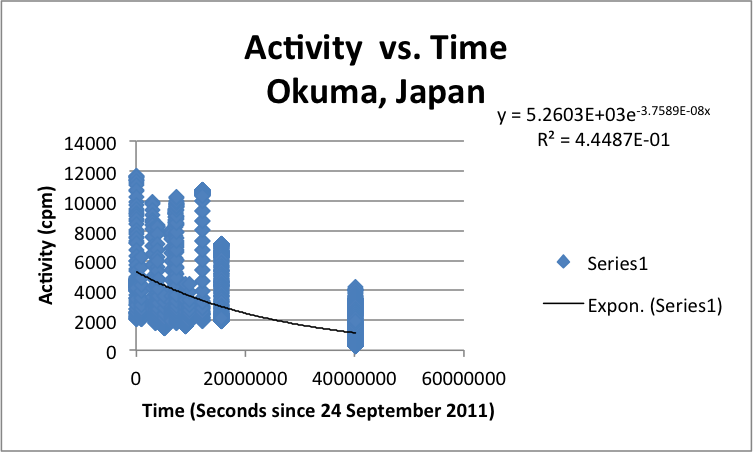
Below is a series of radioactivity versus time graphs for eight locations across Japan over the past two years. All of the data was taken from the Safecast public database with selection areas consisting of squares 2km on a side selected around a given GPS coordinate.
All of the above decay curves were generated using uniform squares of four square kilometers in area. While this decreases spatial resolution it is useful for gathering significant statistics for a given location. Further analysis could compare the relationship between the area of a study and the characteristics of the decay curve. Similarly, this first look doesn’t consider the geography of the location. It would stand to reason that the topography, soil, and climate of a given location should have a noticeable impact on the rate of change in surface radioactivity. Generally, as the number of readings increases over time, the significance of the analysis from any location should improve.